
3D Scatter Plot of data read from a file
November 29, 2007 Posted by Emre S. Tasci
We’re soon going to need this information when playing a game called clustering so, it’s handy to have this around.
Suppose that the data belong to the positions of some number of particles given in Cartesian coordinates. The file (let’s assume it resides in the root of the d drive, having the name "lol1.txt") looks something similar to this:
4.455 3.302 6.858
4.909 4.997 5.447
6.898 8.167 7.083
8.589 5.387 4.953
5.222 3.425 5.684
8.568 6.414 6.037
6.348 2.604 5.356
7.584 7.778 2.810
8.544 9.546 9.098
3.724 5.381 4.913
6.561 8.245 6.550
9.231 5.904 2.066
9.578 6.581 3.521
2.239 1.841 1.004
7.703 5.159 5.714
4.411 6.937 2.433
First, let’s try it in Mathematica:
m=OpenRead["d:\lol1.txt"];
k= ReadList[m,Number];
Close[m];
(k =Partition[k,3]) // TableForm
(* And you can definitely Plot it too *)
<<Graphics`Graphics3D`
PlotStyle->{{PointSize[0.04],GrayLevel[0.09]}}]
Actually, I just copied the above code from a previous entry (but I had updated it just yesterday, so it is still fresh) the output graph will look like this:
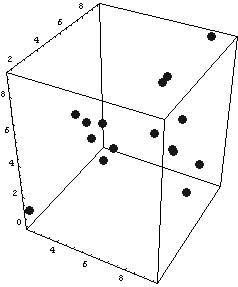
It is not that much practical to change the view angle (or most probably I don’t know how to do it) using Mathematica…
You can, for example, try something like this:
For[i=1,i<10,i+=1,ScatterPlot3D[k,PlotStyle->{{PointSize[0.04],GrayLevel[0.09]}},ViewPoint->{-2,i,2},AxesLabel->{"x","y","z"}]]
Or, if you have Mathcad with you, you can do this much simpler and more enjoyable way, too (but be warned, if I believed that Mathcad was superior to Mathematica, I would have a category for Mathcad instead of Mathematica category I’m having now – Mathcad actually from time to time makes you want to bite the keyboard! ;)! I decided to use Mathcad to visualize my scatter pattern and at once realized that, it has been nearly 5 years since I last used it. My favourite package used to be MapleV but -in my opinion- the Waterloo guys just tore it down when they switched the code language to Java. That was when our ways parted. Maple had nice graphics feature, too. So, if you’re using please send me your version of this entry… So, back to Mathcad:
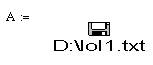
First, from the "Insert…" menu, select "Component", then "File Read or Write" as the type and then select "Read from file". Browse to the designated file and make sure that "Use comma as decimal symbol" is unchecked since we’re using "." for the seperator. By the way, I’m using Mathcad2001 so it may (may?! more like surely!) be a little bit different about the options…
Attach a symbol to this file, say A so that now we have smt like:
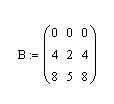
Now, just for the fun of it, define another set like:
You may also check your data if you want:
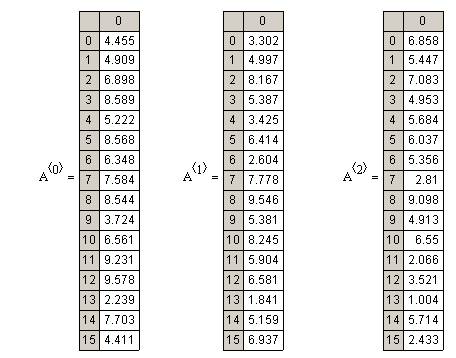
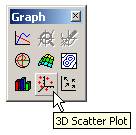
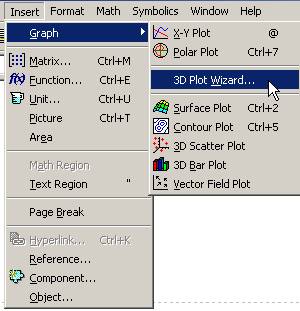
Now define a 3D Scatter Plot either from the Graph Pallette, or more preferably from the Insert menu:
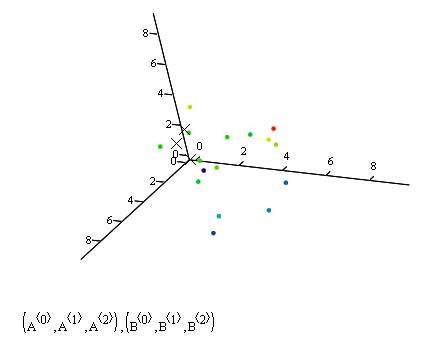
Fill in the data section of the plot as (A<0>,A<1>,A<2>),(B<0>,B<1>,B<2>) and it’s all yours!
With mathcad I was able to rotate the graph whichever way I wanted and also could easily include data from different sources (like the A and B in the example) and plot them any way I wanted to. Here are the snapshots from a more "cute" plot with 500 data points:
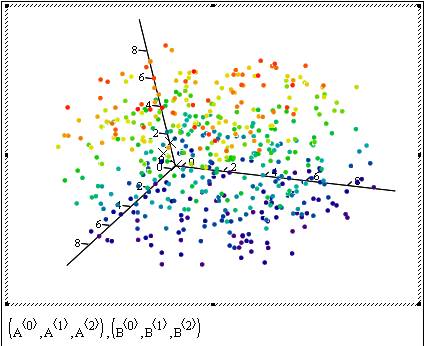
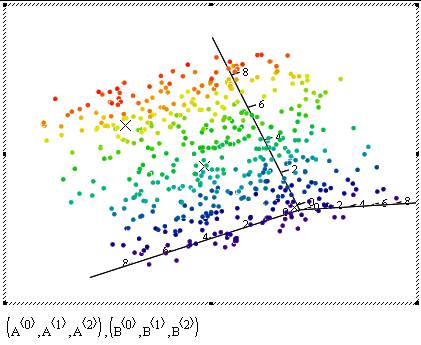
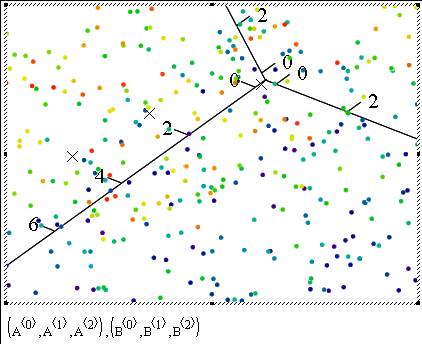
Hint for our game to be announced: Let’s call the little points in the plot as data’s and the Xs as "K-Means"

December 3, 2007 at 9:15 am
Of course, a much more cheaper and surely effective way to plot can be obtained using the marvellous GNUPlot, in which you can simply write
splot “dataFile1.txt”,”dataFile2.txt”
and that’s all!
For further details and examples, please refer to:
http://gnuplot.sourceforge.net/demo/scatter.html
December 3, 2009 at 7:20 pm
I personally never used neither Mathematica or Maple yet I did have a go with Mathcad 2001i on a few occasion and my overall experience was good in terms of plotting capabilities.
Altogether if I needed to plot anything I usually just whacked it into spreadsheet and that did it for me; obviously I am not a hardcore plotting guru. I always felt that Mathcad has a better set of capabilities than a normal excel yet this feeling might have just come from the fact that Mathcad has a generally broad grasp on Math rather Excel.
Anyway, this posting is a very interesting reading and it nicely encompasses the advantages as well as shortcomings of Mathematica as well as Mathcad…
Thank you for this article.
CroAxis