
Octave Functions for Information Gain (Mutual Information)
April 7, 2008 Posted by Emre S. Tasci
Here is some set of functions freshly coded in GNU Octave that deal with Information Gain and related quantities.
For theoretical background and mathematica correspondence of the functions refer to : A Crash Course on Information Gain & some other DataMining terms and How To Get There (my 21/11/2007dated post)
function [t r p] = est_members(x)
Finds the distinct members of given vector x returns 3 vectors r, t and p where :
r : ordered unique member list
t : number of occurences of each element in r
p : probability of each element in r
Example :
octave:234> x
x =
1 2 3 3 2 1 1
octave:235> [r t p] = est_members(x)
r =
1 2 3
t =
3 2 2
p =
0.42857 0.28571 0.28571
function C = est_scent(z,x,y,y_n)
Calculates the specific conditional entropy H(X|Y=y_n)
It is assumed that:
X is stored in the x. row of z
Y is stored in the y. row of z
Example :
octave:236> y
y =
1 2 1 1 2 3 2
octave:237> z=[x;y]
z =
1 2 3 3 2 1 1
1 2 1 1 2 3 2
octave:238> est_scent(z,1,2,2)
ans = 0.63651
function cent = est_cent(z,x,y)
Calculates the conditional entropy H(X|Y)
It is assumed that:
X is stored in the x. row of z
Y is stored in the y. row of z
Example :
octave:239> est_cent(z,1,2)
ans = 0.54558
function ig = est_ig(z,x,y)
Calculates the Information Gain (Mutual Information) IG(X|Y) = H(X) – H(X|Y)
It is assumed that:
X is stored in the x. row of z
Y is stored in the y. row of z
Example :
octave:240> est_ig(z,1,2)
ans = 0.53341
function ig = est_ig2(x,y)
Calculates the Information Gain IG(X|Y) = H(X) – H(X|Y)
Example :
octave:186> est_ig2(x,y)
ans = 0.53341
function ig = est_ig2n(x,y)
Calculates the Normalized Information Gain
IG(X|Y) = [H(X) – H(X|Y)]/min(H(X),H(Y))
Example :
octave:187> est_ig2n(x,y)
ans = 0.53116
function ent = est_entropy(p)
Calculates the entropy for the given probabilities vector p :
H(P) = – SUM(p_i * Log(p_i))
Example :
octave:241> p
p =
0.42857 0.28571 0.28571
octave:242> est_entropy(p)
ans = 1.0790
function ent = est_entropy_from_values(x)
Calculates the entropy for the given values vector x:
H(P) = -Sum(p(a_i) * Log(p(a_i))
where {a} is the set of possible values for x.
Example :
octave:243> x
x =
1 2 3 3 2 1 1
octave:244> est_entropy_from_values(x)
ans = 1.0790
Supplementary function files:
function [t r p] = est_members(x)
% Finds the distinct members of x
% r : ordered unique member list
% t : number of occurences of each element in r
% p : probability of each element in r
% Emre S. Tasci 7/4/2008
t = unique(x);
l = 0;
for i = t
l++;
r(l) = length(find(x==i));
endfor
N = length(x);
p = r/N;
endfunction
function C = est_scent(z,x,y,y_n)
% Calculates the specific conditional entropy H(X|Y=y_n)
% It is assumed that:
% X is stored in the x. row of z
% Y is stored in the y. row of z
% y_n is located in the list of possible values of y
% (i.e. [r t p] = est_members(z(y,:))
% y_n = r(n)
% Emre S. Tasci 7/4/2008
[r t p] = est_members(z(x,:)(z(y,:)==y_n));
C = est_entropy(p);
endfunction
function cent = est_cent(z,x,y)
% Calculates the conditional entropy H(X|Y)
% It is assumed that:
% X is stored in the x. row of z
% Y is stored in the y. row of z
% Emre S. Tasci 7/4/2008
cent = 0;
j = 0;
[r t p] = est_members(z(y,:));
for i=r
j++;
cent += p(j)*est_scent(z,x,y,i);
endfor
endfunction
function ig = est_ig(z,x,y)
% Calculates the Information Gain IG(X|Y) = H(X) – H(X|Y)
% X is stored in the x. row of z
% Y is stored in the y. row of z
% Emre S. Tasci 7/4/2008
[r t p] = est_members(z(x,:));
ig = est_entropy(p) – est_cent(z,x,y);
endfunction
function ig = est_ig2(x,y)
% Calculates the Information Gain IG(X|Y) = H(X) – H(X|Y)
% Emre S. Tasci <e.tasci@tudelft.nl> 8/4/2008
z = [x;y];
[r t p] = est_members(z(1,:));
ig = est_entropy(p) – est_cent(z,1,2);
endfunction
function ig = est_ig2n(x,y)
% Calculates the Normalized Information Gain
% IG(X|Y) = [H(X) – H(X|Y)]/min(H(X),H(Y))
% Emre S. Tasci <e.tasci@tudelft.nl> 8/4/2008
z = [x;y];
[r t p] = est_members(z(1,:));
entx = est_entropy(p);
enty = est_entropy_from_values(y);
minent = min(entx,enty);
ig = (entx – est_cent(z,1,2))/minent;
endfunction
function ent = est_entropy(p)
% Calculates the Entropy of the given probability vector X:
% H(X) = – Sigma(X*Log(x))
% If you want to directly calculate the entropy from values array
% use est_entropy_from_values(X) function
%
% Emre S. Tasci 7/4/2008
ent = 0;
for i = p
ent += -i*log(i);
endfor
endfunction
function ent = est_entropy_from_values(x)
% Calculates the Entropy of the given set of values X:
% H(X) = – Sigma(p(X_i)*Log(p(X_i)))
% If you want to calculate the entropy from probabilities array
% use est_entropy(X) function
%
% Emre S. Tasci 7/4/2008
ent = 0;
[r t p] = est_members(x);
for i = p
ent += -i*log(i);
endfor
endfunction
Less is More MySQL
January 9, 2008 Posted by Emre S. Tasci
(-Right now, I’m going to define a new category: the MySQL category!-)
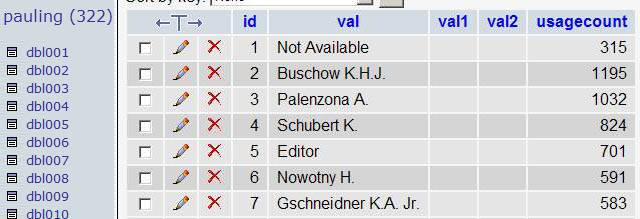
Suppose that, you have a database which contains a huge number of entries about the materials (like, for instance, the Pauling Database). Let it have 163 different properties we can query about. It is optimized for queries, so, the values are enumerated and the labels for these are kept in "pauling.dblxxx" tables, which may be something like this for the "Chemical System" property:

The values are kept in "pauling.valxxx" tables:
.jpg)
(Where the first one is the EntryCode, the PRIMARY key that relates all the tables and the second value is the enumeration for the value. For example, 1422 for the 13. property is actually Ho-Ir 🙂
![]()
and there is one more set of tables, the paulingv2.valxxx tables which are stored and keyed in val order, so:
- if we want to find the EntryCodes corresponding to a given property, we query the paulingv2.valxxx tables
- if we want to find the property that is corresponding to a given EntryCode we query the pauling.valxxx tables
- if we want to "translate" the property’s enumeration, we query the pauling.dblxxx tables.
Here is the thing: Let’s say that we want the Structure Types that have an Atomic Enviroment Type (AET) of a rhombic dodecahedron , with a/b ratio 1, alpha=beta=90o. The property numbers for these are:
Structure Type : 32
AET : 86
a/b ratio : 44
alpha : 41
beta : 42
Since the last three properties are numeric, we don’t enumerate them and the enumeration corresponding to the rhombic dodecahedron for AET is 6. So, fasten your seat belts, we are about to lift off! :
SELECT id,pauling.dbl032.val FROM pauling.dbl032
INNER JOIN
(
SELECT DISTINCT val FROM val032
INNER JOIN
(
SELECT v AS EntryCode FROM
(
(
SELECT val001.val AS v FROM val001
INNER JOIN paulingv2.val086
USING (EntryCode)
WHERE paulingv2.val086.val=6
) AS A
INNER JOIN
(
(
SELECT val001.val AS v FROM val001
INNER JOIN paulingv2.val044
USING (EntryCode)
WHERE paulingv2.val044.val=1
) AS B
INNER JOIN
(
# 41=90 && 42= 90
(
SELECT val001.val AS v FROM val001
INNER JOIN paulingv2.val041
USING (EntryCode)
WHERE paulingv2.val041.val=90
) AS C
INNER JOIN
(
SELECT val001.val AS v FROM val001
INNER JOIN paulingv2.val042
USING (EntryCode)
WHERE paulingv2.val042.val=90
) AS D
USING (v)
)
USING (v)
)
USING (v)
)
) AS G
USING (EntryCode)
)
AS Q ON (id = Q.val) ORDER BY val;
Later addition: Assuming 86=6; we don’t really need the other constraints 44=1, 42=90, 41=90 – do we?… So it’s just the boring:
SELECT id FROM pauling.dbl032
INNER JOIN
(
SELECT DISTINCT val FROM val032
INNER JOIN
(
SELECT v AS EntryCode FROM
(
(
SELECT val001.val AS v FROM val001
INNER JOIN paulingv2.val086
USING (EntryCode)
WHERE paulingv2.val086.val=6
) AS A
)
) AS G
USING (EntryCode)
)
AS Q ON (id = Q.val) ORDER BY Q.val;
The result of this is something like this:

To be honest, it is actually something like this :

The strange symbols are the price we pay for using non-standard charsets! 😉
So, to tidy up, I import this to a table with the following structure:
CREATE TABLE IF NOT EXISTS `bcc` (
`id` smallint(5) unsigned NOT NULL default ‘0’,
`val` varchar(254) NOT NULL default ”,
`usagecount` smallint(5) unsigned NOT NULL default ‘0’,
`val1` varchar(30) NOT NULL default ‘0’,
`val2` varchar(6) default NULL,
`val3` varchar(3) default NULL,
`val1t` varchar(30) NOT NULL,
`val2sp` smallint(5) unsigned NOT NULL,
`SG` tinyint(3) unsigned NOT NULL,
PRIMARY KEY (`id`),
KEY `val` (`val`),
KEY `val1` (`val1`)
) ENGINE=MyISAM DEFAULT CHARSET=utf8;
You have already met the id and val columns. "usagecount" will be imported from the pauling.dbl013 table; val1, val2, val3 are the seperated structure type information (ie, for "CuTi,tp4,129", val1="CuTi", val2="tp4" and val3="129"); val1t is the "translated" version of val1 which is the readeable one (ie, "(Ag¡•¦§Zn¡•¥¥)©Zn" is translated as "(Ag0.56Zn0.44)8Zn"). The translation is done via the following simpe php function:
function translate_symbols($string,$f_tr2symb=true)
{
$symbol_array = array("•","¡","¢","£","¤","¥","¦","§","¨","©","ª");//subscript values
$transl_array = array(".","0","1","2","3","4","5","6","7","8","9");//subscript values
if(!$f_tr2symb)return str_replace($transl_array,$symbol_array,$string);
else return str_replace($symbol_array,$transl_array,$string);
}
"val2sp" is the sliced numeric value from the Pearson Symbol stored in the val2 column.
To tidy up:
$query = "SELECT id, val1, val2 FROM bcc";
$qresult = mysql_query($query);
while($result = mysql_fetch_array($qresult))
{
$query2 = "UPDATE bcc SET val1t=\"".translate_symbols($result["val1"])."\", val2sp=SUBSTRING(val2,3,20) WHERE id = ".$result["id"]." LIMIT 1";
//echo $query2."\n";
$q2result = mysql_query($query2);
echo mysql_error();
}
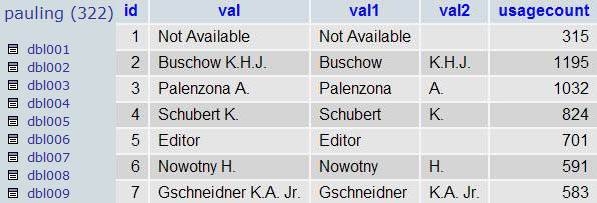
You can refer to my previous entry for slicing up the "val" column. I had already done this while constructing the pauling.dblxxx tables, so in fact the actual view of the pauling.dbl032 table is the following one

meaning, I can just import them using the id’s of my new table:
UPDATE bcc, pauling.dbl032 SET
bcc.val = pauling.dbl032.val,
bcc.usagecount = pauling.dbl032.usagecount,
bcc.val1 = pauling.dbl032.val1,
bcc.val2 = pauling.dbl032.val2,
bcc.val3 = pauling.dbl032.val3
WHERE bcc.id = pauling.dbl032.id
Now we have something like:

We still have some work to do. Let’s take the two structures Ni2Al and Ni2In. Say that we are looking for superstructures, which have the property that the "atoms occupy atomic positions according to the parent crystal structure". The AET for Ni2Al is given as 14-b;14-b;14-b; whereas the AET for Ni2In is given as 11-a;11-a;14-b; . We want every atom to have the parent crystal structure (14-b – the rhombic dodecahedron for bcc), so we will eliminate those ones that have other AET.
mysql_query("USE pauling");
$ids_q = mysql_query("SELECT id FROM s07pt.bcc");
while($ids = mysql_fetch_row($ids_q))
{
$id= $ids[0];
$query = "
SELECT COUNT(DISTINCT val) FROM pauling.val032
INNER JOIN
(
SELECT v AS EntryCode FROM
(
SELECT pauling.val001.val AS v FROM pauling.val001
INNER JOIN paulingv2.val032
USING (EntryCode)
WHERE paulingv2.val032.val = ".$id."
) AS A
INNER JOIN
(
SELECT pauling.val001.val AS v FROM pauling.val001
INNER JOIN paulingv2.val086
USING (EntryCode)
WHERE paulingv2.val086.val != 6
) AS B
USING (v)
) as C USING (EntryCode)";
$query = mysql_query($query);
$result = mysql_fetch_row($query);
$result = mysql_result($query,0);
$result = ($result+1)%2;
$query = "UPDATE s07pt.bcc SET incl_theo = $result where id = $id LIMIT 1";
$j++;
echo $j.".\t".$query."\n";
mysql_query($query);
}
"incl_theo" is the column which is equal to 1 if the structure in question contains no AET other than 14-b, 0 otherwise. This gives us smt. like:

Boasting? I guess so… 8)
December 21, 2007 Posted by Emre S. Tasci
Suppose that you’ve collected some data from the output of a program. Let’s say that some part of this data consists of Author names something similar to:
You want to split the initials from the surnames. This is piece of cake with PHP but I don’t want to go parsing each row of which there are many… So, take a look at this ugly beauty:
aaaaand here is what you get:
if you are thinking something similar to
UPDATE dbl004 SET val1 = LEFT(val,LOCATE(" ",val)-1), val2 = RIGHT(val,LENGTH(val)-LOCATE(" ",val));
or
UPDATE dbl004 set val1 = TRIM(SUBSTRING(SUBSTRING_INDEX(val,".",1),1,LENGTH(SUBSTRING_INDEX(val,".",1)) – LENGTH(SUBSTRING_INDEX(SUBSTRING_INDEX(val,".",1)," ",-1)))), val2 = TRIM(SUBSTRING(val, LENGTH(SUBSTRING_INDEX(val,".",1)) – LENGTH(SUBSTRING_INDEX(SUBSTRING_INDEX(val,".",1)," ",-1))));
Try to process these 3 values: "van der Graaf K.L. Jr.", "Not Available" and "Editor".
About this entry: I couldn’t refrain myself from boasting after I managed to come up with that beautiful MySQL query… sorry for that. (Yes, I know, superbia, the 7th and the most deadly…) So let me try to balance this arrogant entry of mine:
With my best regards,
Your humble blogger…
SAGE: Open Source Mathematics Software
December 9, 2007 Posted by Emre S. Tasci
I don’t know how it is but it offers pretty much and does this in the free spirit so I’m oughta give this software a try. Will inform you when I cover some bases…

Some “trivial” derivations
December 4, 2007 Posted by Emre S. Tasci
Information Theory, Inference, and Learning Algorithms by David MacKay, Exercise 22.5:
A random variable x is assumed to have a probability distribution that is a mixture of two Gaussians,
![Formula: % MathType!MTEF!2!1!+-
% feaafiart1ev1aaatCvAUfeBSjuyZL2yd9gzLbvyNv2CaerbuLwBLn
% hiov2DGi1BTfMBaeXatLxBI9gBaerbd9wDYLwzYbItLDharqqtubsr
% 4rNCHbGeaGqiVu0Je9sqqrpepC0xbbL8F4rqqrFfpeea0xe9Lq-Jc9
% vqaqpepm0xbba9pwe9Q8fs0-yqaqpepae9pg0FirpepeKkFr0xfr-x
% fr-xb9adbaqaaeGaciGaaiaabeqaamaabaabaaGcbaGaamiuamaabm
% aabaGaamiEaiaacYhacqaH8oqBdaWgaaWcbaGaaGymaaqabaGccaGG
% SaGaeqiVd02aaSbaaSqaaiaaikdaaeqaaOGaaiilaiabeo8aZbGaay
% jkaiaawMcaaiabg2da9maadmaabaWaaabCaeaacaWGWbWaaSbaaSqa
% aiaadUgaaeqaaOWaaSaaaeaacaaIXaaabaWaaOaaaeaacaaIYaGaeq
% iWdaNaeq4Wdm3aaWbaaSqabeaacaaIYaaaaaqabaaaaOGaciyzaiaa
% cIhacaGGWbWaaeWaaeaacqGHsisldaWcaaqaamaabmaabaGaamiEai
% abgkHiTiabeY7aTnaaBaaaleaacaWGRbaabeaaaOGaayjkaiaawMca
% amaaCaaaleqabaGaaGOmaaaaaOqaaiaaikdacqaHdpWCdaahaaWcbe
% qaaiaaikdaaaaaaaGccaGLOaGaayzkaaaaleaacaWGRbGaeyypa0Ja
% aGymaaqaaiaaikdaa0GaeyyeIuoaaOGaay5waiaaw2faaaaa!63A5!
\[
P\left( {x|\mu _1 ,\mu _2 ,\sigma } \right) = \left[ {\sum\limits_{k = 1}^2 {p_k \frac{1}
{{\sqrt {2\pi \sigma ^2 } }}\exp \left( { - \frac{{\left( {x - \mu _k } \right)^2 }}
{{2\sigma ^2 }}} \right)} } \right]
\]](../latex_cache/02ffa24cafcda9c52b21f37689acad79.png)
where the two Gaussians are given the labels k = 1 and k = 2; the prior probability of the class label k is {p1 = 1/2, p2 = 1/2}; ![Formula: % MathType!MTEF!2!1!+-
% feaafiart1ev1aaatCvAUfeBSjuyZL2yd9gzLbvyNv2CaerbuLwBLn
% hiov2DGi1BTfMBaeXatLxBI9gBaerbd9wDYLwzYbItLDharqqtubsr
% 4rNCHbGeaGqiVu0Je9sqqrpepC0xbbL8F4rqqrFfpeea0xe9Lq-Jc9
% vqaqpepm0xbba9pwe9Q8fs0-yqaqpepae9pg0FirpepeKkFr0xfr-x
% fr-xb9adbaqaaeGaciGaaiaabeqaamaabaabaaGcbaWaaiWaaeaacq
% aH8oqBdaWgaaWcbaGaam4AaaqabaaakiaawUhacaGL9baaaaa!3AFA!
\[
{\left\{ {\mu _k } \right\}}
\]](../latex_cache/63181a36e52687072bbbd54c4488895f.png) are the means of the two Gaussians; and both have standard deviation sigma. For brevity, we denote these parameters by
are the means of the two Gaussians; and both have standard deviation sigma. For brevity, we denote these parameters by
![Formula: % MathType!MTEF!2!1!+-
% feaafiart1ev1aaatCvAUfeBSjuyZL2yd9gzLbvyNv2CaerbuLwBLn
% hiov2DGi1BTfMBaeXatLxBI9gBaerbd9wDYLwzYbItLDharqqtubsr
% 4rNCHbGeaGqiVu0Je9sqqrpepC0xbbL8F4rqqrFfpeea0xe9Lq-Jc9
% vqaqpepm0xbba9pwe9Q8fs0-yqaqpepae9pg0FirpepeKkFr0xfr-x
% fr-xb9adbaqaaeGaciGaaiaabeqaamaabaabaaGcbaGaaCiUdiabgg
% Mi6oaacmaabaWaaiWaaeaacqaH8oqBdaWgaaWcbaGaam4Aaaqabaaa
% kiaawUhacaGL9baacaGGSaGaeq4WdmhacaGL7bGaayzFaaaaaa!42AB!
\[
{\mathbf{\theta }} \equiv \left\{ {\left\{ {\mu _k } \right\},\sigma } \right\}
\]](../latex_cache/0872f8d876f08afa90626cfb8bfd6165.png)
A data set consists of N points ![Formula: % MathType!MTEF!2!1!+-
% feaafiart1ev1aaatCvAUfeBSjuyZL2yd9gzLbvyNv2CaerbuLwBLn
% hiov2DGi1BTfMBaeXatLxBI9gBaerbd9wDYLwzYbItLDharqqtubsr
% 4rNCHbGeaGqiVu0Je9sqqrpepC0xbbL8F4rqqrFfpeea0xe9Lq-Jc9
% vqaqpepm0xbba9pwe9Q8fs0-yqaqpepae9pg0FirpepeKkFr0xfr-x
% fr-xb9adbaqaaeGaciGaaiaabeqaamaabaabaaGcbaWaaiWaaeaaca
% WG4bWaaSbaaSqaaiaad6gaaeqaaaGccaGL7bGaayzFaaWaa0baaSqa
% aiaad6gacqGH9aqpcaaIXaaabaGaamOtaaaaaaa!3DF8!
\[
\left\{ {x_n } \right\}_{n = 1}^N
\]](../latex_cache/5960b3e63e93b0eadb7f05b6597dc081.png) which are assumed to be independent samples from the distribution. Let kn denote the unknown class label of the nth point.
which are assumed to be independent samples from the distribution. Let kn denote the unknown class label of the nth point.
Assuming that and ![Formula: % MathType!MTEF!2!1!+-
% feaafiart1ev1aaatCvAUfeBSjuyZL2yd9gzLbvyNv2CaerbuLwBLn
% hiov2DGi1BTfMBaeXatLxBI9gBaerbd9wDYLwzYbItLDharqqtubsr
% 4rNCHbGeaGqiVu0Je9sqqrpepC0xbbL8F4rqqrFfpeea0xe9Lq-Jc9
% vqaqpepm0xbba9pwe9Q8fs0-yqaqpepae9pg0FirpepeKkFr0xfr-x
% fr-xb9adbaqaaeGaciGaaiaabeqaamaabaabaaGcbaGaeq4Wdmhaaa!37B0!
\[
\sigma
\]](../latex_cache/0bcead44095f85d706d5bd0d3ee69019.png) are known, show that the posterior probability of the class label kn of the nth point can be written as
are known, show that the posterior probability of the class label kn of the nth point can be written as
![Formula: % MathType!MTEF!2!1!+-
% feaafiart1ev1aaatCvAUfeBSjuyZL2yd9gzLbvyNv2CaerbuLwBLn
% hiov2DGi1BTfMBaeXatLxBI9gBaerbd9wDYLwzYbItLDharqqtubsr
% 4rNCHbGeaGqiVu0Je9sqqrpepC0xbbL8F4rqqrFfpeea0xe9Lq-Jc9
% vqaqpepm0xbba9pwe9Q8fs0-yqaqpepae9pg0FirpepeKkFr0xfr-x
% fr-xb9adbaqaaeGaciGaaiaabeqaamaabaabaaGceaqabeaacaWGqb
% WaaeWaaeaadaabcaqaaiaadUgadaWgaaWcbaGaamOBaaqabaGccqGH
% 9aqpcaaIXaaacaGLiWoacaWG4bWaaSbaaSqaaiaad6gaaeqaaOGaai
% ilaiaahI7aaiaawIcacaGLPaaacqGH9aqpdaWcaaqaaiaaigdaaeaa
% caaIXaGaey4kaSIaciyzaiaacIhacaGGWbWaamWaaeaacqGHsislda
% qadaqaaiabeM8a3naaBaaaleaacaaIXaaabeaakiaadIhadaWgaaWc
% baGaamOBaaqabaGccqGHRaWkcqaHjpWDdaWgaaWcbaGaaGimaaqaba
% aakiaawIcacaGLPaaaaiaawUfacaGLDbaaaaaabaGaamiuamaabmaa
% baWaaqGaaeaacaWGRbWaaSbaaSqaaiaad6gaaeqaaOGaeyypa0JaaG
% OmaaGaayjcSdGaamiEamaaBaaaleaacaWGUbaabeaakiaacYcacaWH
% 4oaacaGLOaGaayzkaaGaeyypa0ZaaSaaaeaacaaIXaaabaGaaGymai
% abgUcaRiGacwgacaGG4bGaaiiCamaadmaabaGaey4kaSYaaeWaaeaa
% cqaHjpWDdaWgaaWcbaGaaGymaaqabaGccaWG4bWaaSbaaSqaaiaad6
% gaaeqaaOGaey4kaSIaeqyYdC3aaSbaaSqaaiaaicdaaeqaaaGccaGL
% OaGaayzkaaaacaGLBbGaayzxaaaaaaaaaa!7422!
\[
\begin{gathered}
P\left( {\left. {k_n = 1} \right|x_n ,{\mathbf{\theta }}} \right) = \frac{1}
{{1 + \exp \left[ { - \left( {\omega _1 x_n + \omega _0 } \right)} \right]}} \hfill \\
P\left( {\left. {k_n = 2} \right|x_n ,{\mathbf{\theta }}} \right) = \frac{1}
{{1 + \exp \left[ { + \left( {\omega _1 x_n + \omega _0 } \right)} \right]}} \hfill \\
\end{gathered}
\]](../latex_cache/f1256d14a59790f5d35c2bedc4a49bbc.png)
and give expressions for ![Formula: \[\omega _1 \]](../latex_cache/9b85d537fe39f505e5182913d97fdfb8.png) and
and ![Formula: \[\omega _0 \]](../latex_cache/dfa670f67ce3c9849cc5c143a295efac.png) .
.
Derivation:
![Formula: % MathType!MTEF!2!1!+-
% feaafiart1ev1aaatCvAUfeBSjuyZL2yd9gzLbvyNv2CaerbuLwBLn
% hiov2DGi1BTfMBaeXatLxBI9gBaerbd9wDYLwzYbItLDharqqtubsr
% 4rNCHbGeaGqiVu0Je9sqqrpepC0xbbL8F4rqqrFfpeea0xe9Lq-Jc9
% vqaqpepm0xbba9pwe9Q8fs0-yqaqpepae9pg0FirpepeKkFr0xfr-x
% fr-xb9adbaqaaeGaciGaaiaabeqaamaabaabaaGcbaGaamiuamaabm
% aabaWaaqGaaeaacaWGRbWaaSbaaSqaaiaad6gaaeqaaOGaeyypa0Ja
% aGymaaGaayjcSdGaamiEamaaBaaaleaacaWGUbaabeaakiaacYcaca
% WH4oaacaGLOaGaayzkaaGaeyypa0ZaaSaaaeaacaWGqbWaaeWaaeaa
% caWG4bWaaSbaaSqaaiaad6gaaeqaaOWaaqqaaeaacaWGRbWaaSbaaS
% qaaiaad6gaaeqaaOGaeyypa0JaaGymaiaacYcacaWH4oaacaGLhWoa
% aiaawIcacaGLPaaacaWGqbWaaeWaaeaacaWGRbWaaSbaaSqaaiaad6
% gaaeqaaOGaeyypa0JaaGymaaGaayjkaiaawMcaaaqaaiaadcfadaqa
% daqaaiaadIhadaWgaaWcbaGaamOBaaqabaaakiaawIcacaGLPaaaaa
% aaaa!598D!
\[
P\left( {\left. {k_n = 1} \right|x_n ,{\mathbf{\theta }}} \right) = \frac{{P\left( {x_n \left| {k_n = 1,{\mathbf{\theta }}} \right.} \right)P\left( {k_n = 1} \right)}}
{{P\left( {x_n } \right)}}
\]](../latex_cache/a715c20187b7d1333ddd7eac5d275abb.png)
![Formula: % MathType!MTEF!2!1!+-
% feaafiart1ev1aaatCvAUfeBSjuyZL2yd9gzLbvyNv2CaerbuLwBLn
% hiov2DGi1BTfMBaeXatLxBI9gBaerbd9wDYLwzYbItLDharqqtubsr
% 4rNCHbGeaGqiVu0Je9sqqrpepC0xbbL8F4rqqrFfpeea0xe9Lq-Jc9
% vqaqpepm0xbba9pwe9Q8fs0-yqaqpepae9pg0FirpepeKkFr0xfr-x
% fr-xb9adbaqaaeGaciGaaiaabeqaamaabaabaaGcbaGaamiuamaabm
% aabaGaamiEamaaBaaaleaacaWGUbaabeaakmaaeeaabaGaam4Aamaa
% BaaaleaacaWGUbaabeaakiabg2da9iaaigdacaGGSaGaaCiUdaGaay
% 5bSdaacaGLOaGaayzkaaGaeyypa0ZaaSaaaeaacaaIXaaabaWaaOaa
% aeaacaaIYaGaeqiWdaNaeq4Wdm3aaWbaaSqabeaacaaIYaaaaaqaba
% aaaOGaciyzaiaacIhacaGGWbWaaeWaaeaacqGHsisldaWcaaqaamaa
% bmaabaGaamiEamaaBaaaleaacaWGUbaabeaakiabgkHiTiabeY7aTn
% aaBaaaleaacaaIXaaabeaaaOGaayjkaiaawMcaamaaCaaaleqabaGa
% aGOmaaaaaOqaaiaaikdacqaHdpWCdaahaaWcbeqaaiaaikdaaaaaaa
% GccaGLOaGaayzkaaaaaa!59EC!
\[
P\left( {x_n \left| {k_n = 1,{\mathbf{\theta }}} \right.} \right) = \frac{1}
{{\sqrt {2\pi \sigma ^2 } }}\exp \left( { - \frac{{\left( {x_n - \mu _1 } \right)^2 }}
{{2\sigma ^2 }}} \right)
\]](../latex_cache/fad7cf1dcafb714f7a176d734a527a09.png)
![Formula: % MathType!MTEF!2!1!+-
% feaafiart1ev1aaatCvAUfeBSjuyZL2yd9gzLbvyNv2CaerbuLwBLn
% hiov2DGi1BTfMBaeXatLxBI9gBaerbd9wDYLwzYbItLDharqqtubsr
% 4rNCHbGeaGqiVu0Je9sqqrpepC0xbbL8F4rqqrFfpeea0xe9Lq-Jc9
% vqaqpepm0xbba9pwe9Q8fs0-yqaqpepae9pg0FirpepeKkFr0xfr-x
% fr-xb9adbaqaaeGaciGaaiaabeqaamaabaabaaGcbaGaamiuamaabm
% aabaGaamiEamaaBaaaleaacaWGUbaabeaaaOGaayjkaiaawMcaaiab
% g2da9maaqahabaGaamiuamaabmaabaWaaqGaaeaacaWG4bWaaSbaaS
% qaaiaad6gaaeqaaaGccaGLiWoacaWGRbWaaSbaaSqaaiaad6gaaeqa
% aOGaeyypa0JaamyAaiaacYcacaWH4oaacaGLOaGaayzkaaGaamiuam
% aabmaabaGaam4AamaaBaaaleaacaWGUbaabeaakiabg2da9iaadMga
% aiaawIcacaGLPaaaaSqaaiaadMgacqGH9aqpcaaIXaaabaGaaGOmaa
% qdcqGHris5aaaa!53AA!
\[
P\left( {x_n } \right) = \sum\limits_{i = 1}^2 {P\left( {\left. {x_n } \right|k_n = i,{\mathbf{\theta }}} \right)P\left( {k_n = i} \right)}
\]](../latex_cache/4552f718d3d4a5d314db5eec6e935fe6.png)
![Formula: % MathType!MTEF!2!1!+-
% feaafiart1ev1aaatCvAUfeBSjuyZL2yd9gzLbvyNv2CaerbuLwBLn
% hiov2DGi1BTfMBaeXatLxBI9gBaerbd9wDYLwzYbItLDharqqtubsr
% 4rNCHbGeaGqiVu0Je9sqqrpepC0xbbL8F4rqqrFfpeea0xe9Lq-Jc9
% vqaqpepm0xbba9pwe9Q8fs0-yqaqpepae9pg0FirpepeKkFr0xfr-x
% fr-xb9adbaqaaeGaciGaaiaabeqaamaabaabaaGceaqabeaacaWGqb
% WaaeWaaeaadaabcaqaaiaadUgadaWgaaWcbaGaamOBaaqabaGccqGH
% 9aqpcaaIXaaacaGLiWoacaWG4bWaaSbaaSqaaiaad6gaaeqaaOGaai
% ilaiaahI7aaiaawIcacaGLPaaacqGH9aqpdaWcaaqaamaalaaabaGa
% aGymaaqaamaakaaabaGaaGOmaiabec8aWjabeo8aZnaaCaaaleqaba
% GaaGOmaaaaaeqaaaaakiGacwgacaGG4bGaaiiCamaabmaabaGaeyOe
% I0YaaSaaaeaadaqadaqaaiaadIhadaWgaaWcbaGaamOBaaqabaGccq
% GHsislcqaH8oqBdaWgaaWcbaGaaGymaaqabaaakiaawIcacaGLPaaa
% daahaaWcbeqaaiaaikdaaaaakeaacaaIYaGaeq4Wdm3aaWbaaSqabe
% aacaaIYaaaaaaaaOGaayjkaiaawMcaaiaadcfadaqadaqaaiaadUga
% daWgaaWcbaGaamOBaaqabaGccqGH9aqpcaaIXaaacaGLOaGaayzkaa
% aabaWaaSaaaeaacaaIXaaabaWaaOaaaeaacaaIYaGaeqiWdaNaeq4W
% dm3aaWbaaSqabeaacaaIYaaaaaqabaaaaOGaciyzaiaacIhacaGGWb
% WaaeWaaeaacqGHsisldaWcaaqaamaabmaabaGaamiEamaaBaaaleaa
% caWGUbaabeaakiabgkHiTiabeY7aTnaaBaaaleaacaaIXaaabeaaaO
% GaayjkaiaawMcaamaaCaaaleqabaGaaGOmaaaaaOqaaiaaikdacqaH
% dpWCdaahaaWcbeqaaiaaikdaaaaaaaGccaGLOaGaayzkaaGaamiuam
% aabmaabaGaam4AamaaBaaaleaacaWGUbaabeaakiabg2da9iaaigda
% aiaawIcacaGLPaaacqGHRaWkdaWcaaqaaiaaigdaaeaadaGcaaqaai
% aaikdacqaHapaCcqaHdpWCdaahaaWcbeqaaiaaikdaaaaabeaaaaGc
% ciGGLbGaaiiEaiaacchadaqadaqaaiabgkHiTmaalaaabaWaaeWaae
% aacaWG4bWaaSbaaSqaaiaad6gaaeqaaOGaeyOeI0IaeqiVd02aaSba
% aSqaaiaaikdaaeqaaaGccaGLOaGaayzkaaWaaWbaaSqabeaacaaIYa
% aaaaGcbaGaaGOmaiabeo8aZnaaCaaaleqabaGaaGOmaaaaaaaakiaa
% wIcacaGLPaaacaWGqbWaaeWaaeaacaWGRbWaaSbaaSqaaiaad6gaae
% qaaOGaeyypa0JaaGOmaaGaayjkaiaawMcaaaaaaeaacqGH9aqpdaWc
% aaqaaiaaigdaaeaacaaIXaGaey4kaSIaciyzaiaacIhacaGGWbWaae
% WaaeaacqGHsisldaWcaaqaamaabmaabaGaamiEamaaBaaaleaacaWG
% UbaabeaakiabgkHiTiabeY7aTnaaBaaaleaacaaIYaaabeaaaOGaay
% jkaiaawMcaamaaCaaaleqabaGaaGOmaaaaaOqaaiaaikdacqaHdpWC
% daahaaWcbeqaaiaaikdaaaaaaOGaey4kaSYaaSaaaeaadaqadaqaai
% aadIhadaWgaaWcbaGaamOBaaqabaGccqGHsislcqaH8oqBdaWgaaWc
% baGaaGymaaqabaaakiaawIcacaGLPaaadaahaaWcbeqaaiaaikdaaa
% aakeaacaaIYaGaeq4Wdm3aaWbaaSqabeaacaaIYaaaaaaaaOGaayjk
% aiaawMcaamaabmaabaWaaSaaaeaacaaIXaGaeyOeI0Iaamiuamaabm
% aabaGaam4AamaaBaaaleaacaWGUbaabeaakiabg2da9iaaigdaaiaa
% wIcacaGLPaaaaeaacaWGqbWaaeWaaeaacaWGRbWaaSbaaSqaaiaad6
% gaaeqaaOGaeyypa0JaaGymaaGaayjkaiaawMcaaaaaaiaawIcacaGL
% Paaaaaaaaaa!CC7A!
\[
\begin{gathered}
P\left( {\left. {k_n = 1} \right|x_n ,{\mathbf{\theta }}} \right) = \frac{{\frac{1}
{{\sqrt {2\pi \sigma ^2 } }}\exp \left( { - \frac{{\left( {x_n - \mu _1 } \right)^2 }}
{{2\sigma ^2 }}} \right)P\left( {k_n = 1} \right)}}
{{\frac{1}
{{\sqrt {2\pi \sigma ^2 } }}\exp \left( { - \frac{{\left( {x_n - \mu _1 } \right)^2 }}
{{2\sigma ^2 }}} \right)P\left( {k_n = 1} \right) + \frac{1}
{{\sqrt {2\pi \sigma ^2 } }}\exp \left( { - \frac{{\left( {x_n - \mu _2 } \right)^2 }}
{{2\sigma ^2 }}} \right)P\left( {k_n = 2} \right)}} \hfill \\
= \frac{1}
{{1 + \exp \left( { - \frac{{\left( {x_n - \mu _2 } \right)^2 }}
{{2\sigma ^2 }} + \frac{{\left( {x_n - \mu _1 } \right)^2 }}
{{2\sigma ^2 }}} \right)\left( {\frac{{1 - P\left( {k_n = 1} \right)}}
{{P\left( {k_n = 1} \right)}}} \right)}} \hfill \\
\end{gathered}
\]](../latex_cache/1e6fdf2c5d24e2be5c59df57c14121ec.png)
![Formula: % MathType!MTEF!2!1!+-
% feaafiart1ev1aaatCvAUfeBSjuyZL2yd9gzLbvyNv2CaerbuLwBLn
% hiov2DGi1BTfMBaeXatLxBI9gBaerbd9wDYLwzYbItLDharqqtubsr
% 4rNCHbGeaGqiVu0Je9sqqrpepC0xbbL8F4rqqrFfpeea0xe9Lq-Jc9
% vqaqpepm0xbba9pwe9Q8fs0-yqaqpepae9pg0FirpepeKkFr0xfr-x
% fr-xb9adbaqaaeGaciGaaiaabeqaamaabaabaaGcbaGaeyypa0ZaaS
% aaaeaacaaIXaaabaGaaGymaiabgUcaRiGacwgacaGG4bGaaiiCamaa
% dmaabaGaeyOeI0YaaeWaaeaadaqadaqaamaalaaabaWaaeWaaeaacq
% aH8oqBdaWgaaWcbaGaaGymaaqabaGccqGHsislcqaH8oqBdaWgaaWc
% baGaaGOmaaqabaaakiaawIcacaGLPaaaaeaacqaHdpWCdaahaaWcbe
% qaaiaaikdaaaaaaaGccaGLOaGaayzkaaGaamiEamaaBaaaleaacaWG
% UbaabeaakiabgUcaRmaabmaabaWaaSaaaeaadaqadaqaaiabeY7aTn
% aaBaaaleaacaaIYaaabeaakmaaCaaaleqabaGaaGOmaaaakiabgkHi
% TiabeY7aTnaaBaaaleaacaaIXaaabeaakmaaCaaaleqabaGaaGOmaa
% aaaOGaayjkaiaawMcaaaqaaiaaikdacqaHdpWCdaahaaWcbeqaaiaa
% ikdaaaaaaaGccaGLOaGaayzkaaaacaGLOaGaayzkaaaacaGLBbGaay
% zxaaaaaaaa!5E70!
\[
= \frac{1}
{{1 + \exp \left[ { - \left( {\left( {\frac{{\left( {\mu _1 - \mu _2 } \right)}}
{{\sigma ^2 }}} \right)x_n + \left( {\frac{{\left( {\mu _2 ^2 - \mu _1 ^2 } \right)}}
{{2\sigma ^2 }}} \right)} \right)} \right]}}
\]](../latex_cache/2cb3dc1005d19db77232acac5cfde110.png)
![Formula: % MathType!MTEF!2!1!+-
% feaafiart1ev1aaatCvAUfeBSjuyZL2yd9gzLbvyNv2CaerbuLwBLn
% hiov2DGi1BTfMBaeXatLxBI9gBaerbd9wDYLwzYbItLDharqqtubsr
% 4rNCHbGeaGqiVu0Je9sqqrpepC0xbbL8F4rqqrFfpeea0xe9Lq-Jc9
% vqaqpepm0xbba9pwe9Q8fs0-yqaqpepae9pg0FirpepeKkFr0xfr-x
% fr-xb9adbaqaaeGaciGaaiaabeqaamaabaabaaGcbaGaeyypa0ZaaS
% aaaeaacaaIXaaabaGaaGymaiabgUcaRiGacwgacaGG4bGaaiiCamaa
% dmaabaGaeyOeI0YaaeWaaeaacqaHjpWDdaWgaaWcbaGaaGymaaqaba
% GccaWG4bWaaSbaaSqaaiaad6gaaeqaaOGaey4kaSIaeqyYdC3aaSba
% aSqaaiaaicdaaeqaaaGccaGLOaGaayzkaaaacaGLBbGaayzxaaaaaa
% aa!4921!
\[
= \frac{1}
{{1 + \exp \left[ { - \left( {\omega _1 x_n + \omega _0 } \right)} \right]}}
\]](../latex_cache/fad0a283da2a75ecc80ae95039e225d9.png)
![Formula: % MathType!MTEF!2!1!+-
% feaafiart1ev1aaatCvAUfeBSjuyZL2yd9gzLbvyNv2CaerbuLwBLn
% hiov2DGi1BTfMBaeXatLxBI9gBaerbd9wDYLwzYbItLDharqqtubsr
% 4rNCHbGeaGqiVu0Je9sqqrpepC0xbbL8F4rqqrFfpeea0xe9Lq-Jc9
% vqaqpepm0xbba9pwe9Q8fs0-yqaqpepae9pg0FirpepeKkFr0xfr-x
% fr-xb9adbaqaaeGaciGaaiaabeqaamaabaabaaGcbaGaeqyYdC3aaS
% baaSqaaiaaigdaaeqaaOGaeyyyIO7aaSaaaeaadaqadaqaaiabeY7a
% TnaaBaaaleaacaaIXaaabeaakiabgkHiTiabeY7aTnaaBaaaleaaca
% aIYaaabeaaaOGaayjkaiaawMcaaaqaaiabeo8aZnaaCaaaleqabaGa
% aGOmaaaaaaGccaGG7aGaaCzcaiabeM8a3naaBaaaleaacaaIWaaabe
% aakiabggMi6oaalaaabaWaaeWaaeaacqaH8oqBdaWgaaWcbaGaaGOm
% aaqabaGcdaahaaWcbeqaaiaaikdaaaGccqGHsislcqaH8oqBdaWgaa
% WcbaGaaGymaaqabaGcdaahaaWcbeqaaiaaikdaaaaakiaawIcacaGL
% PaaaaeaacaaIYaGaeq4Wdm3aaWbaaSqabeaacaaIYaaaaaaaaaa!5809!
\[
\omega _1 \equiv \frac{{\left( {\mu _1 - \mu _2 } \right)}}
{{\sigma ^2 }}; & \omega _0 \equiv \frac{{\left( {\mu _2 ^2 - \mu _1 ^2 } \right)}}
{{2\sigma ^2 }}
\]](../latex_cache/ecb970e7b19db2f916b89d7f4f9ff62f.png)
Assume now that the means are not known, and that we wish to infer them from the data . (The standard deviation is known.) In the remainder of this question we will derive an iterative algorithm for finding values for that maximize the likelihood,
![Formula: % MathType!MTEF!2!1!+-
% feaafiart1ev1aaatCvAUfeBSjuyZL2yd9gzLbvyNv2CaerbuLwBLn
% hiov2DGi1BTfMBaeXatLxBI9gBaerbd9wDYLwzYbItLDharqqtubsr
% 4rNCHbGeaGqiVu0Je9sqqrpepC0xbbL8F4rqqrFfpeea0xe9Lq-Jc9
% vqaqpepm0xbba9pwe9Q8fs0-yqaqpepae9pg0FirpepeKkFr0xfr-x
% fr-xb9adbaqaaeGaciGaaiaabeqaamaabaabaaGcbaGaamiuamaabm
% aabaWaaiWaaeaacaWG4bWaaSbaaSqaaiaad6gaaeqaaaGccaGL7bGa
% ayzFaaWaa0baaSqaaiaad6gacqGH9aqpcaaIXaaabaGaamOtaaaakm
% aaeeaabaWaaiWaaeaacqaH8oqBdaWgaaWcbaGaam4Aaaqabaaakiaa
% wUhacaGL9baacaGGSaGaeq4WdmhacaGLhWoaaiaawIcacaGLPaaacq
% GH9aqpdaqeqbqaaiaadcfadaqadaqaaiaadIhadaWgaaWcbaGaamOB
% aaqabaGcdaabbaqaamaacmaabaGaeqiVd02aaSbaaSqaaiaadUgaae
% qaaaGccaGL7bGaayzFaaGaaiilaiabeo8aZbGaay5bSdaacaGLOaGa
% ayzkaaaaleaacaWGUbaabeqdcqGHpis1aOGaaiOlaaaa!5BD3!
\[
P\left( {\left\{ {x_n } \right\}_{n = 1}^N \left| {\left\{ {\mu _k } \right\},\sigma } \right.} \right) = \prod\limits_n {P\left( {x_n \left| {\left\{ {\mu _k } \right\},\sigma } \right.} \right)} .
\]](../latex_cache/e8f09972b3500b374a1e5b0fd19ae615.png)
Let L denote the natural log of the likelihood. Show that the derivative of the log likelihood with respect to ![Formula: \[{\mu _k }\]](../latex_cache/8e114e04047dfd2df6cd90fecc90cc9d.png) is given by
is given by
![Formula: % MathType!MTEF!2!1!+-
% feaafiart1ev1aaatCvAUfeBSjuyZL2yd9gzLbvyNv2CaerbuLwBLn
% hiov2DGi1BTfMBaeXatLxBI9gBaerbd9wDYLwzYbItLDharqqtubsr
% 4rNCHbGeaGqiVu0Je9sqqrpepC0xbbL8F4rqqrFfpeea0xe9Lq-Jc9
% vqaqpepm0xbba9pwe9Q8fs0-yqaqpepae9pg0FirpepeKkFr0xfr-x
% fr-xb9adbaqaaeGaciGaaiaabeqaamaabaabaaGcbaWaaSaaaeaacq
% GHciITaeaacqGHciITcqaH8oqBdaWgaaWcbaGaam4AaaqabaaaaOGa
% amitaiabg2da9maaqafabaGaamiCamaaBaaaleaacaWGRbGaaiiFai
% aad6gaaeqaaOWaaSaaaeaadaqadaqaaiaadIhadaWgaaWcbaGaamOB
% aaqabaGccqGHsislcqaH8oqBdaWgaaWcbaGaam4AaaqabaaakiaawI
% cacaGLPaaaaeaacqaHdpWCdaahaaWcbeqaaiaaikdaaaaaaOGaaiil
% aaWcbaGaamOBaaqab0GaeyyeIuoaaaa!4F8E!
\[
\frac{\partial }
{{\partial \mu _k }}L = \sum\limits_n {p_{k|n} \frac{{\left( {x_n - \mu _k } \right)}}
{{\sigma ^2 }},}
\]](../latex_cache/968180dae9f9ec36821998cd8cc198f2.png)
where ![Formula: % MathType!MTEF!2!1!+-
% feaafiart1ev1aaatCvAUfeBSjuyZL2yd9gzLbvyNv2CaerbuLwBLn
% hiov2DGi1BTfMBaeXatLxBI9gBaerbd9wDYLwzYbItLDharqqtubsr
% 4rNCHbGeaGqiVu0Je9sqqrpepC0xbbL8F4rqqrFfpeea0xe9Lq-Jc9
% vqaqpepm0xbba9pwe9Q8fs0-yqaqpepae9pg0FirpepeKkFr0xfr-x
% fr-xb9adbaqaaeGaciGaaiaabeqaamaabaabaaGcbaGaamiCamaaBa
% aaleaacaWGRbGaaiiFaiaad6gaaeqaaOGaeyyyIORaamiuamaabmaa
% baGaam4AamaaBaaaleaacaWGUbaabeaakiabg2da9iaadUgadaabba
% qaaiaadIhadaWgaaWcbaGaamOBaaqabaGccaGGSaGaaCiUdaGaay5b
% SdaacaGLOaGaayzkaaaaaa!47DF!
\[
p_{k|n} \equiv P\left( {k_n = k\left| {x_n ,{\mathbf{\theta }}} \right.} \right)
\]](../latex_cache/1b5e0ed28e9818454709a25da45ef545.png) appeared above.
appeared above.
Derivation:
![Formula: % MathType!MTEF!2!1!+-
% feaafiart1ev1aaatCvAUfeBSjuyZL2yd9gzLbvyNv2CaerbuLwBLn
% hiov2DGi1BTfMBaeXatLxBI9gBaerbd9wDYLwzYbItLDharqqtubsr
% 4rNCHbGeaGqiVu0Je9sqqrpepC0xbbL8F4rqqrFfpeea0xe9Lq-Jc9
% vqaqpepm0xbba9pwe9Q8fs0-yqaqpepae9pg0FirpepeKkFr0xfr-x
% fr-xb9adbaqaaeGaciGaaiaabeqaamaabaabaaGcbaWaaSaaaeaacq
% GHciITaeaacqGHciITcqaH8oqBdaWgaaWcbaGaam4AaaqabaaaaOGa
% ciiBaiaac6gacaWGqbWaaeWaaeaadaGadaqaaiaadIhadaWgaaWcba
% GaamOBaaqabaaakiaawUhacaGL9baadaqhaaWcbaGaamOBaiabg2da
% 9iaaigdaaeaacaWGobaaaOWaaqqaaeaadaGadaqaaiabeY7aTnaaBa
% aaleaacaWGRbaabeaaaOGaay5Eaiaaw2haaiaacYcacqaHdpWCaiaa
% wEa7aaGaayjkaiaawMcaaiabg2da9maalaaabaGaeyOaIylabaGaey
% OaIyRaeqiVd02aaSbaaSqaaiaadUgaaeqaaaaakmaaqafabaGaciiB
% aiaac6gacaWGqbWaaeWaaeaacaWG4bWaaSbaaSqaaiaad6gaaeqaaO
% WaaqqaaeaadaGadaqaaiabeY7aTnaaBaaaleaacaWGRbaabeaaaOGa
% ay5Eaiaaw2haaiaacYcacqaHdpWCaiaawEa7aaGaayjkaiaawMcaaa
% WcbaGaamOBaaqab0GaeyyeIuoaaaa!6A60!
\[
\frac{\partial }
{{\partial \mu _k }}\ln P\left( {\left\{ {x_n } \right\}_{n = 1}^N \left| {\left\{ {\mu _k } \right\},\sigma } \right.} \right) = \frac{\partial }
{{\partial \mu _k }}\sum\limits_n {\ln P\left( {x_n \left| {\left\{ {\mu _k } \right\},\sigma } \right.} \right)}
\]](../latex_cache/d4fff688e4cb4a830395b148a0388ad0.png)
![Formula: % MathType!MTEF!2!1!+-
% feaafiart1ev1aaatCvAUfeBSjuyZL2yd9gzLbvyNv2CaerbuLwBLn
% hiov2DGi1BTfMBaeXatLxBI9gBaerbd9wDYLwzYbItLDharqqtubsr
% 4rNCHbGeaGqiVu0Je9sqqrpepC0xbbL8F4rqqrFfpeea0xe9Lq-Jc9
% vqaqpepm0xbba9pwe9Q8fs0-yqaqpepae9pg0FirpepeKkFr0xfr-x
% fr-xb9adbaqaaeGaciGaaiaabeqaamaabaabaaGcbaGaeyypa0ZaaS
% aaaeaacqGHciITaeaacqGHciITcqaH8oqBdaWgaaWcbaGaam4Aaaqa
% baaaaOWaaabuaeaaciGGSbGaaiOBamaadmaabaWaaabuaeaacaWGWb
% WaaSbaaSqaaiaadUgaaeqaaOWaaSaaaeaacaaIXaaabaWaaOaaaeaa
% caaIYaGaeqiWdaNaeq4Wdm3aaWbaaSqabeaacaaIYaaaaaqabaaaaO
% GaciyzaiaacIhacaGGWbWaamWaaeaacqGHsisldaWcaaqaamaabmaa
% baGaeqiVd02aaSbaaSqaaiaadUgaaeqaaOGaeyOeI0IaamiEamaaBa
% aaleaacaWGUbaabeaaaOGaayjkaiaawMcaamaaCaaaleqabaGaaGOm
% aaaaaOqaaiaaikdacqaHdpWCdaahaaWcbeqaaiaaikdaaaaaaaGcca
% GLBbGaayzxaaaaleaacaWGRbaabeqdcqGHris5aaGccaGLBbGaayzx
% aaaaleaacaWGUbaabeqdcqGHris5aaaa!6080!
\[
= \frac{\partial }
{{\partial \mu _k }}\sum\limits_n {\ln \left[ {\sum\limits_k {p_k \frac{1}
{{\sqrt {2\pi \sigma ^2 } }}\exp \left[ { - \frac{{\left( {\mu _k - x_n } \right)^2 }}
{{2\sigma ^2 }}} \right]} } \right]}
\]](../latex_cache/86e7b4035c45e740407f4e2862f3fcca.png)
![Formula: % MathType!MTEF!2!1!+-
% feaafiart1ev1aaatCvAUfeBSjuyZL2yd9gzLbvyNv2CaerbuLwBLn
% hiov2DGi1BTfMBaeXatLxBI9gBaerbd9wDYLwzYbItLDharqqtubsr
% 4rNCHbGeaGqiVu0Je9sqqrpepC0xbbL8F4rqqrFfpeea0xe9Lq-Jc9
% vqaqpepm0xbba9pwe9Q8fs0-yqaqpepae9pg0FirpepeKkFr0xfr-x
% fr-xb9adbaqaaeGaciGaaiaabeqaamaabaabaaGcbaGaeyypa0Zaaa
% buaeaadaWadaqaamaalaaabaGaamiCamaaBaaaleaacaWGRbaabeaa
% kmaalaaabaGaaGymaaqaamaakaaabaGaaGOmaiabec8aWjabeo8aZn
% aaCaaaleqabaGaaGOmaaaaaeqaaaaakmaalaaabaWaaeWaaeaacaWG
% 4bWaaSbaaSqaaiaad6gaaeqaaOGaeyOeI0IaeqiVd02aaSbaaSqaai
% aadUgaaeqaaaGccaGLOaGaayzkaaaabaGaeq4Wdm3aaWbaaSqabeaa
% caaIYaaaaaaakiGacwgacaGG4bGaaiiCamaadmaabaGaeyOeI0YaaS
% aaaeaadaqadaqaaiabeY7aTnaaBaaaleaacaWGRbaabeaakiabgkHi
% TiaadIhadaWgaaWcbaGaamOBaaqabaaakiaawIcacaGLPaaadaahaa
% WcbeqaaiaaikdaaaaakeaacaaIYaGaeq4Wdm3aaWbaaSqabeaacaaI
% YaaaaaaaaOGaay5waiaaw2faaaqaamaaqafabaGaamiCamaaBaaale
% aacaWGRbaabeaakmaalaaabaGaaGymaaqaamaakaaabaGaaGOmaiab
% ec8aWjabeo8aZnaaCaaaleqabaGaaGOmaaaaaeqaaaaakiGacwgaca
% GG4bGaaiiCamaadmaabaGaeyOeI0YaaSaaaeaadaqadaqaaiabeY7a
% TnaaBaaaleaacaWGRbaabeaakiabgkHiTiaadIhadaWgaaWcbaGaam
% OBaaqabaaakiaawIcacaGLPaaadaahaaWcbeqaaiaaikdaaaaakeaa
% caaIYaGaeq4Wdm3aaWbaaSqabeaacaaIYaaaaaaaaOGaay5waiaaw2
% faaaWcbaGaam4Aaaqab0GaeyyeIuoaaaaakiaawUfacaGLDbaaaSqa
% aiaad6gaaeqaniabggHiLdaaaa!7CFE!
\[
= \sum\limits_n {\left[ {\frac{{p_k \frac{1}
{{\sqrt {2\pi \sigma ^2 } }}\frac{{\left( {x_n - \mu _k } \right)}}
{{\sigma ^2 }}\exp \left[ { - \frac{{\left( {\mu _k - x_n } \right)^2 }}
{{2\sigma ^2 }}} \right]}}
{{\sum\limits_k {p_k \frac{1}
{{\sqrt {2\pi \sigma ^2 } }}\exp \left[ { - \frac{{\left( {\mu _k - x_n } \right)^2 }}
{{2\sigma ^2 }}} \right]} }}} \right]}
\]](../latex_cache/36d5d46d163b2f0805d07742b2476015.png)
![Formula: % MathType!MTEF!2!1!+-
% feaafiart1ev1aaatCvAUfeBSjuyZL2yd9gzLbvyNv2CaerbuLwBLn
% hiov2DGi1BTfMBaeXatLxBI9gBaerbd9wDYLwzYbItLDharqqtubsr
% 4rNCHbGeaGqiVu0Je9sqqrpepC0xbbL8F4rqqrFfpeea0xe9Lq-Jc9
% vqaqpepm0xbba9pwe9Q8fs0-yqaqpepae9pg0FirpepeKkFr0xfr-x
% fr-xb9adbaqaaeGaciGaaiaabeqaamaabaabaaGcbaWaaabuaeaaca
% WGWbWaaSbaaSqaaiaadUgaaeqaaOWaaSaaaeaacaaIXaaabaWaaOaa
% aeaacaaIYaGaeqiWdaNaeq4Wdm3aaWbaaSqabeaacaaIYaaaaaqaba
% aaaOGaciyzaiaacIhacaGGWbWaamWaaeaacqGHsisldaWcaaqaamaa
% bmaabaGaeqiVd02aaSbaaSqaaiaadUgaaeqaaOGaeyOeI0IaamiEam
% aaBaaaleaacaWGUbaabeaaaOGaayjkaiaawMcaamaaCaaaleqabaGa
% aGOmaaaaaOqaaiaaikdacqaHdpWCdaahaaWcbeqaaiaaikdaaaaaaa
% GccaGLBbGaayzxaaaaleaacaWGRbaabeqdcqGHris5aOGaeyypa0Za
% aabuaeaacaWGqbWaaeWaaeaadaabcaqaaiaadIhadaWgaaWcbaGaam
% OBaaqabaaakiaawIa7aiaadUgadaWgaaWcbaGaamOBaaqabaGccqGH
% 9aqpcaWGPbGaaiilaiaahI7aaiaawIcacaGLPaaacaWGqbWaaeWaae
% aacaWGRbWaaSbaaSqaaiaad6gaaeqaaOGaeyypa0JaamyAaaGaayjk
% aiaawMcaaaWcbaGaamyAaaqab0GaeyyeIuoaaaa!6973!
\[
\sum\limits_k {p_k \frac{1}
{{\sqrt {2\pi \sigma ^2 } }}\exp \left[ { - \frac{{\left( {\mu _k - x_n } \right)^2 }}
{{2\sigma ^2 }}} \right]} = \sum\limits_i {P\left( {\left. {x_n } \right|k_n = i,{\mathbf{\theta }}} \right)P\left( {k_n = i} \right)}
\]](../latex_cache/ac64de78a66933a927e697ce3399accb.png)
![Formula: % MathType!MTEF!2!1!+-
% feaafiart1ev1aaatCvAUfeBSjuyZL2yd9gzLbvyNv2CaerbuLwBLn
% hiov2DGi1BTfMBaeXatLxBI9gBaerbd9wDYLwzYbItLDharqqtubsr
% 4rNCHbGeaGqiVu0Je9sqqrpepC0xbbL8F4rqqrFfpeea0xe9Lq-Jc9
% vqaqpepm0xbba9pwe9Q8fs0-yqaqpepae9pg0FirpepeKkFr0xfr-x
% fr-xb9adbaqaaeGaciGaaiaabeqaamaabaabaaGcbaGaamiCamaaBa
% aaleaacaWGRbaabeaakmaalaaabaGaaGymaaqaamaakaaabaGaaGOm
% aiabec8aWjabeo8aZnaaCaaaleqabaGaaGOmaaaaaeqaaaaakiGacw
% gacaGG4bGaaiiCamaadmaabaGaeyOeI0YaaSaaaeaadaqadaqaaiab
% eY7aTnaaBaaaleaacaWGRbaabeaakiabgkHiTiaadIhadaWgaaWcba
% GaamOBaaqabaaakiaawIcacaGLPaaadaahaaWcbeqaaiaaikdaaaaa
% keaacaaIYaGaeq4Wdm3aaWbaaSqabeaacaaIYaaaaaaaaOGaay5wai
% aaw2faaiabg2da9iaadcfadaqadaqaaiaadUgadaWgaaWcbaGaamOB
% aaqabaGccqGH9aqpcaWGRbaacaGLOaGaayzkaaGaamiuamaabmaaba
% GaamiEamaaBaaaleaacaWGUbaabeaakmaaeeaabaGaam4AamaaBaaa
% leaacaWGUbaabeaakiabg2da9iaadUgacaGGSaGaaCiUdaGaay5bSd
% aacaGLOaGaayzkaaaaaa!6347!
\[
p_k \frac{1}
{{\sqrt {2\pi \sigma ^2 } }}\exp \left[ { - \frac{{\left( {\mu _k - x_n } \right)^2 }}
{{2\sigma ^2 }}} \right] = P\left( {k_n = k} \right)P\left( {x_n \left| {k_n = k,{\mathbf{\theta }}} \right.} \right)
\]](../latex_cache/e7fad6f8f95484fb7540dd2f4a2fc8fc.png)
![Formula: % MathType!MTEF!2!1!+-
% feaafiart1ev1aaatCvAUfeBSjuyZL2yd9gzLbvyNv2CaerbuLwBLn
% hiov2DGi1BTfMBaeXatLxBI9gBaerbd9wDYLwzYbItLDharqqtubsr
% 4rNCHbGeaGqiVu0Je9sqqrpepC0xbbL8F4rqqrFfpeea0xe9Lq-Jc9
% vqaqpepm0xbba9pwe9Q8fs0-yqaqpepae9pg0FirpepeKkFr0xfr-x
% fr-xb9adbaqaaeGaciGaaiaabeqaamaabaabaaGcbaGaeyO0H49aaS
% aaaeaacqGHciITaeaacqGHciITcqaH8oqBdaWgaaWcbaGaam4Aaaqa
% baaaaOGaciiBaiaac6gacaWGqbWaaeWaaeaadaGadaqaaiaadIhada
% WgaaWcbaGaamOBaaqabaaakiaawUhacaGL9baadaqhaaWcbaGaamOB
% aiabg2da9iaaigdaaeaacaWGobaaaOWaaqqaaeaadaGadaqaaiabeY
% 7aTnaaBaaaleaacaWGRbaabeaaaOGaay5Eaiaaw2haaiaacYcacqaH
% dpWCaiaawEa7aaGaayjkaiaawMcaaiabg2da9maaqafabaWaaSaaae
% aacaWGqbWaaeWaaeaacaWGRbWaaSbaaSqaaiaad6gaaeqaaOGaeyyp
% a0Jaam4AaaGaayjkaiaawMcaaiaadcfadaqadaqaaiaadIhadaWgaa
% WcbaGaamOBaaqabaGcdaabbaqaaiaadUgadaWgaaWcbaGaamOBaaqa
% baGccqGH9aqpcaWGRbGaaiilaiaahI7aaiaawEa7aaGaayjkaiaawM
% caaaqaamaaqafabaGaamiuamaabmaabaWaaqGaaeaacaWG4bWaaSba
% aSqaaiaad6gaaeqaaaGccaGLiWoacaWGRbWaaSbaaSqaaiaad6gaae
% qaaOGaeyypa0JaamyAaiaacYcacaWH4oaacaGLOaGaayzkaaGaamiu
% amaabmaabaGaam4AamaaBaaaleaacaWGUbaabeaakiabg2da9iaadM
% gaaiaawIcacaGLPaaaaSqaaiaadMgaaeqaniabggHiLdaaaaWcbaGa
% amOBaaqab0GaeyyeIuoakmaalaaabaWaaeWaaeaacaWG4bWaaSbaaS
% qaaiaad6gaaeqaaOGaeyOeI0IaeqiVd02aaSbaaSqaaiaadUgaaeqa
% aaGccaGLOaGaayzkaaaabaGaeq4Wdm3aaWbaaSqabeaacaaIYaaaaa
% aaaaa!89F6!
\[
\Rightarrow \frac{\partial }
{{\partial \mu _k }}\ln P\left( {\left\{ {x_n } \right\}_{n = 1}^N \left| {\left\{ {\mu _k } \right\},\sigma } \right.} \right) = \sum\limits_n {\frac{{P\left( {k_n = k} \right)P\left( {x_n \left| {k_n = k,{\mathbf{\theta }}} \right.} \right)}}
{{\sum\limits_i {P\left( {\left. {x_n } \right|k_n = i,{\mathbf{\theta }}} \right)P\left( {k_n = i} \right)} }}} \frac{{\left( {x_n - \mu _k } \right)}}
{{\sigma ^2 }}
\]](../latex_cache/2c3b479a4f50f6a32f51e3e0e2c7c833.png)
![Formula: % MathType!MTEF!2!1!+-
% feaafiart1ev1aaatCvAUfeBSjuyZL2yd9gzLbvyNv2CaerbuLwBLn
% hiov2DGi1BTfMBaeXatLxBI9gBaerbd9wDYLwzYbItLDharqqtubsr
% 4rNCHbGeaGqiVu0Je9sqqrpepC0xbbL8F4rqqrFfpeea0xe9Lq-Jc9
% vqaqpepm0xbba9pwe9Q8fs0-yqaqpepae9pg0FirpepeKkFr0xfr-x
% fr-xb9adbaqaaeGaciGaaiaabeqaamaabaabaaGcbaGaeyypa0Zaaa
% buaeaacaWGWbWaaSbaaSqaaiaadUgacaGG8bGaamOBaaqabaaabaGa
% amOBaaqab0GaeyyeIuoakmaalaaabaWaaeWaaeaacaWG4bWaaSbaaS
% qaaiaad6gaaeqaaOGaeyOeI0IaeqiVd02aaSbaaSqaaiaadUgaaeqa
% aaGccaGLOaGaayzkaaaabaGaeq4Wdm3aaWbaaSqabeaacaaIYaaaaa
% aaaaa!4840!
\[
= \sum\limits_n {p_{k|n} } \frac{{\left( {x_n - \mu _k } \right)}}
{{\sigma ^2 }}
\]](../latex_cache/c8011d7a11739ee0738f1c36b33e36ea.png)
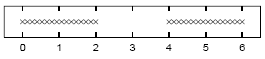
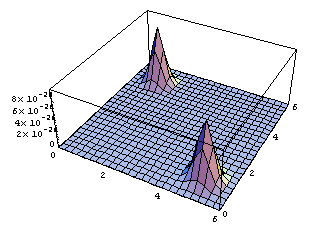
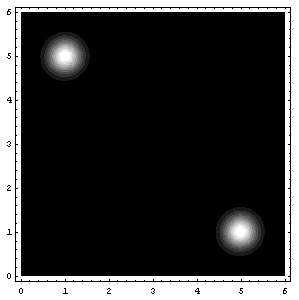
Assuming that =1, sketch a contour plot of the likelihood function as a function of mu1 and mu2 for the data set shown above. The data set consists of 32 points. Describe the peaks in your sketch and indicate their widths.
Solution:
We will be trying to plot the function
![Formula: % MathType!MTEF!2!1!+-
% feaafiart1ev1aaatCvAUfeBSjuyZL2yd9gzLbvyNv2CaerbuLwBLn
% hiov2DGi1BTfMBaeXatLxBI9gBaerbd9wDYLwzYbItLDharqqtubsr
% 4rNCHbGeaGqiVu0Je9sqqrpepC0xbbL8F4rqqrFfpeea0xe9Lq-Jc9
% vqaqpepm0xbba9pwe9Q8fs0-yqaqpepae9pg0FirpepeKkFr0xfr-x
% fr-xb9adbaqaaeGaciGaaiaabeqaamaabaabaaGcbaGaamiuamaabm
% aabaWaaiWaaeaacaWG4bWaaSbaaSqaaiaad6gaaeqaaaGccaGL7bGa
% ayzFaaWaa0baaSqaaiaad6gacqGH9aqpcaaIXaaabaGaamOtaaaakm
% aaeeaabaWaaiWaaeaacqaH8oqBdaWgaaWcbaGaam4Aaaqabaaakiaa
% wUhacaGL9baacaGGSaGaeq4WdmNaeyypa0JaaGymaaGaay5bSdaaca
% GLOaGaayzkaaaaaa!4B35!
\[
P\left( {\left\{ {x_n } \right\}_{n = 1}^32 \left| {\left\{ {\mu _k } \right\},\sigma = 1} \right.} \right)
\]](../latex_cache/71b40c661f5c9db63270e0e74a946f2e.png)
if we designate the function
![Formula: % MathType!MTEF!2!1!+-
% feaafiart1ev1aaatCvAUfeBSjuyZL2yd9gzLbvyNv2CaerbuLwBLn
% hiov2DGi1BTfMBaeXatLxBI9gBaerbd9wDYLwzYbItLDharqqtubsr
% 4rNCHbGeaGqiVu0Je9sqqrpepC0xbbL8F4rqqrFfpeea0xe9Lq-Jc9
% vqaqpepm0xbba9pwe9Q8fs0-yqaqpepae9pg0FirpepeKkFr0xfr-x
% fr-xb9adbaqaaeGaciGaaiaabeqaamaabaabaaGcbaWaaSaaaeaaca
% aIXaaabaWaaOaaaeaacaaIYaGaeqiWdahaleqaaaaakiGacwgacaGG
% 4bGaaiiCamaabmaabaGaeyOeI0YaaSaaaeaadaqadaqaaiaadIhacq
% GHsislcqaH8oqBaiaawIcacaGLPaaadaahaaWcbeqaaiaaikdaaaaa
% keaacaaIYaaaaaGaayjkaiaawMcaaaaa!458F!
\[
{\frac{1}
{{\sqrt {2\pi } }}\exp \left( { - \frac{{\left( {x - \mu } \right)^2 }}
{2}} \right)}
\]](../latex_cache/2ad62d34e3684874733b4cb33953d5d3.png)
as p[x,mu] (remember that =1 and ![Formula: \[\frac{1}{{\sqrt {2\pi } }} = {\text{0}}{\text{.3989422804014327}}\]](../latex_cache/3007395e2c673cf6173195f8f616e34e.png) ),
),
![Formula: % MathType!MTEF!2!1!+-<br />
% feaafiart1ev1aaatCvAUfeBSjuyZL2yd9gzLbvyNv2CaerbuLwBLn<br />
% hiov2DGi1BTfMBaeXatLxBI9gBaerbd9wDYLwzYbItLDharqqtubsr<br />
% 4rNCHbGeaGqiVu0Je9sqqrpepC0xbbL8F4rqqrFfpeea0xe9Lq-Jc9<br />
% vqaqpepm0xbba9pwe9Q8fs0-yqaqpepae9pg0FirpepeKkFr0xfr-x<br />
% fr-xb9adbaqaaeGaciGaaiaabeqaamaabaabaaGceaqabeaacaWGqb<br />
% WaaeWaaeaacaWG4bGaaiiFamaacmaabaGaeqiVd0gacaGL7bGaayzF<br />
% aaGaaiilaiabeo8aZbGaayjkaiaawMcaaiabg2da9maadmaabaWaaa<br />
% bCaeaadaqadaqaaiaadchadaWgaaWcbaGaam4AaaqabaGccqGH9aqp<br />
% caGGUaGaaGynaaGaayjkaiaawMcaamaalaaabaGaaGymaaqaamaaka<br />
% aabaGaaGOmaiabec8aWnaabmaabaGaeq4Wdm3aaWbaaSqabeaacaaI<br />
% YaaaaOGaeyypa0JaaGymamaaCaaaleqabaGaaGOmaaaaaOGaayjkai<br />
% aawMcaaaWcbeaaaaGcciGGLbGaaiiEaiaacchadaqadaqaaiabgkHi<br />
% TmaalaaabaWaaeWaaeaacaWG4bGaeyOeI0IaeqiVd02aaSbaaSqaai<br />
% aadUgaaeqaaaGccaGLOaGaayzkaaWaaWbaaSqabeaacaaIYaaaaaGc<br />
% baGaaGOmaiabeo8aZnaaCaaaleqabaGaaGOmaaaaaaaakiaawIcaca<br />
% GLPaaaaSqaaiaadUgacqGH9aqpcaaIXaaabaGaaGOmaaqdcqGHris5<br />
% aaGccaGLBbGaayzxaaaabaGaeyypa0JaaiOlaiaaiwdadaqadaqaai<br />
% aahchadaWadaqaaiaadIhacaGGSaGaamyBaiaadwhacaaIXaaacaGL<br />
% BbGaayzxaaGaey4kaSIaaCiCamaadmaabaGaamiEaiaacYcacaWGTb<br />
% GaamyDaiaaikdaaiaawUfacaGLDbaaaiaawIcacaGLPaaacqGHHjIU<br />
% caWHWbGaaCiCamaadmaabaGaamiEaiaacYcacaWGTbGaamyDaiaaig<br />
% dacaGGSaGaamyBaiaadwhacaaIYaaacaGLBbGaayzxaaaaaaa!8AA0!<br />
\[<br />
\begin{gathered}<br />
P\left( {x|\left\{ \mu \right\},\sigma } \right) = \left[ {\sum\limits_{k = 1}^2 {\left( {p_k = .5} \right)\frac{1}<br />
{{\sqrt {2\pi \left( {\sigma ^2 = 1^2 } \right)} }}\exp \left( { - \frac{{\left( {x - \mu _k } \right)^2 }}<br />
{{2\sigma ^2 }}} \right)} } \right] \hfill \\<br />
= .5\left( {{\mathbf{p}}\left[ {x,mu1} \right] + {\mathbf{p}}\left[ {x,mu2} \right]} \right) \equiv {\mathbf{pp}}\left[ {x,mu1,mu2} \right] \hfill \\ <br />
\end{gathered} <br />
\]](../latex_cache/d8547ac7bb53e78258a1e9e9b6404ee4.png)
![Formula: % MathType!MTEF!2!1!+-<br />
% feaafiart1ev1aaatCvAUfeBSjuyZL2yd9gzLbvyNv2CaerbuLwBLn<br />
% hiov2DGi1BTfMBaeXatLxBI9gBaerbd9wDYLwzYbItLDharqqtubsr<br />
% 4rNCHbGeaGqiVu0Je9sqqrpepC0xbbL8F4rqqrFfpeea0xe9Lq-Jc9<br />
% vqaqpepm0xbba9pwe9Q8fs0-yqaqpepae9pg0FirpepeKkFr0xfr-x<br />
% fr-xb9adbaqaaeGaciGaaiaabeqaamaabaabaaGceaqabeaacaWGqb<br />
% WaaeWaaeaadaGadaqaaiaadIhadaWgaaWcbaGaamOBaaqabaaakiaa<br />
% wUhacaGL9baadaqhaaWcbaGaamOBaiabg2da9iaaigdaaeaacaWGob<br />
% aaaOWaaqqaaeaadaGadaqaaiabeY7aTnaaBaaaleaacaWGRbaabeaa<br />
% aOGaay5Eaiaaw2haaiaacYcacqaHdpWCaiaawEa7aaGaayjkaiaawM<br />
% caaiabg2da9maarafabaGaamiuamaabmaabaGaamiEamaaBaaaleaa<br />
% caWGUbaabeaakmaaeeaabaWaaiWaaeaacqaH8oqBdaWgaaWcbaGaam<br />
% 4AaaqabaaakiaawUhacaGL9baacaGGSaGaeq4WdmhacaGLhWoaaiaa<br />
% wIcacaGLPaaaaSqaaiaad6gaaeqaniabg+GivdaakeaacqGH9aqpda<br />
% qeqbqaaiaahchacaWHWbWaamWaaeaacaWG4bGaaiilaiaad2gacaWG<br />
% 1bGaaGymaiaacYcacaWGTbGaamyDaiaaikdaaiaawUfacaGLDbaaaS<br />
% qaaiaad6gaaeqaniabg+GivdGccqGHHjIUcaWHWbGaaCiCaiaahcha<br />
% daWadaqaaiaadIhacaGGSaGaamyBaiaadwhacaaIXaGaaiilaiaad2<br />
% gacaWG1bGaaGOmaaGaay5waiaaw2faaaaaaa!791F!<br />
\[<br />
\begin{gathered}<br />
P\left( {\left\{ {x_n } \right\}_{n = 1}^N \left| {\left\{ {\mu _k } \right\},\sigma } \right.} \right) = \prod\limits_n {P\left( {x_n \left| {\left\{ {\mu _k } \right\},\sigma } \right.} \right)} \hfill \\<br />
= \prod\limits_n {{\mathbf{pp}}\left[ {x,mu1,mu2} \right]} \equiv {\mathbf{ppp}}\left[ {x,mu1,mu2} \right] \hfill \\ <br />
\end{gathered} <br />
\]](../latex_cache/45d43b605033a4aa279f5db4b6c5f8cb.png)
then we have:
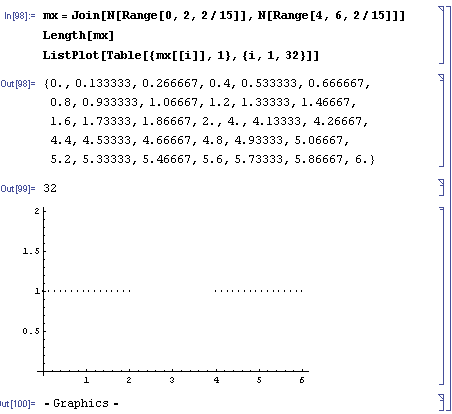
And in Mathematica, these mean:
mx=Join[N[Range[0,2,2/15]],N[Range[4,6,2/15]]]
Length[mx]
ListPlot[Table[{mx[[i]],1},{i,1,32}]]
p[x_,mu_]:=0.3989422804014327` * Exp[-(mu-x)^2/2];
pp[x_,mu1_,mu2_]:=.5 (p[x,mu1]+p[x,mu2]);
ppp[xx_,mu1_,mu2_]:=Module[
{ptot=1},
For[i=1,i<=Length[xx],i++,
ppar = pp[xx[[i]],mu1,mu2];
ptot *= ppar;
(*Print[xx[[i]],"\t",ppar];*)
];
Return[ptot];
];
Plot3D[ppp[mx,mu1,mu2],{mu1,0,6},{mu2,0,6},PlotRange->{0,10^-25}];
ContourPlot[ppp[mx,mu1,mu2],{mu1,0,6},{mu2,0,6},{PlotRange->{0,10^-25},ContourLines->False,PlotPoints->250}];(*It may take a while with PlotPoints->250, so just begin with PlotPoints->25 *)
That’s all folks! (for today I guess 8) (and also, I know that I said next entry would be about the soft K-means two entries ago, but believe me, we’re coming to that, eventually 😉
Attachments: Mathematica notebook for this entry, MSWord Document (actually this one is intended for me, because in the future I may need them again)
